Adding hostnames to dhclient configs

If you have hundreds of stations on your LANforge and want to give them all hostnames, this is certainly possible. Please get the add-dhcp-hostname.pl script from the lanforge-scripts repository.

  1. First bring up your stations with DHCP enabled. This will create your dhclient config files in /home/lanforge/vr_conf.
  2. Admin-down the stations.
  3. With a root shell, go to that vr_conf directory and run this script on the files you want to give hostnames to.
    1. For just one station:
      root# ~lanforge/scripts/add-dhcp-hostname.pl dhclient_sta0000.conf
    2. For all the stations:
      root# ~lanforge/scripts/add-dhcp-hostname.pl dhclient_sta*conf
  4. Admin-up the stations.
    1. If you are sniffing, you will see a DHCP Request packet that has a hostname attribute.
    2. If you are inspecting a LANforge dhcpd server in a virtual router, you would check /home/lanforge/vr_conf/vrcx_eth1_dhcp_lease.db for entries with the setting client-hostname.

That should work.

Adjacent Wifi Channel Throughput Testing

What is the effect of wifi clients on adjacent channels when performing over-the-air wifi throughput testing?

We decided to investigate this question to help show why it happens and also to determine if the physical proximity of the wifi NICs could also be to blame.

After running the tests described below, we found that co-channel interference happens with Access Points using adjacent channels and with LANforge using physically adjacent wifi NICs. LANforge test results show better on-air throughput performance when the PCI-E NICs are physically separated by different systems rather than having the wifi NICs side by side in a single platform.

The test setup consists of two LANforge systems, a CT523c and a CT523b and two identical test APs. The CT523c, labeled LF1, has two 4×4 wifi NICs with clients wlan0 and wlan2. The CT523b, labeled LF2, has two 4×4 wifi NICs, but only one client, wlan2, is in use. The test APs are each setup with a single unique SSID using open authentication and are physically placed about 1m from each LANforge system. Each AP is also using its specified channel at 80MHz channel width.

Each test iteration is a 30 second download test, then 30 second upload test for each individual wifi client and then again for combinations of clients for download and upload.

First test: AP-A on ch100 and AP-B on ch116 – here is what it looked like on inSSIDer:
ch100-ch116-ht80

The baseline results of each individual client show that the test setup has ideal conditions with all clients reporting similar results:
adjacent-channel-tput1

The combination tests show that the clients’ throughput results suffer from the adjacent channel interference:
adjacent-channel-tput1b

If we look at a spectrum analyzer while testing, we can see that the overlap at 5.57GHz between channels 112 and 116 is the reason for the interference.
ch100-ch116-spec

The next test is a repeat of the first but on channels 36 and 52 which are also adjacent to each other.

Test 2: AP-A on ch36 and AP-B on ch52
ch36-ch52-ht80

Test 2 results:
adjacent-channel-tput2

As we move AP-B over to channels further away from AP-A, the combination tests show that the clients experience less interference and therefore show better throughput results:

Test 3: AP-A on ch36 and AP-B on ch100
ch36-ch100-ht80

Test 3 results:
adjacent-channel-tput3

Test 4: AP-A on ch36 and AP-B on ch149
ch36-ch149-ht80

Test 4 results:
adjacent-channel-tput4

Another important conclusion is that the throughput results for a single active NIC in each LANforge system is better than having both NICs active in a single LANforge system. We can show the difference by comparing the total on-air throughput.

In Test 1, channels 100 and 116:
The all-in-one on-air download throughput is 371Mbps + 674Mbps = 1045Mbps.
The separated on-air download throughput is 467Mbps + 963Mbps = 1430Mbps.
1430/1045 = 1.37 (separating the NICs shows a 37% increase).

In Test 2, channels 36 and 52:
The all-in-one on-air download throughput is 351Mbps + 747Mbps = 1098Mbps.
The separated on-air download throughput is 487Mbps = 974Mbps = 1461Mbps.
1461/1098 = 1.33 (separating the NICs shows a 33% increase).

In Test 3, channels 36 and 100:
The all-in-one on-air download throughput is 948Mbps + 966Mbps = 1914Mbps.
The separated on-air download throughput is 982Mbps + 974Mbps = 1956Mbps.
1956/1914 = 1.02 (separating the NICs shows a 2% increase).

In Test 4, channels 36 and 149:
The all-in-one on-air download throughput is 982Mbps + 980Mbps = 1962Mbps.
The separated on-air download throughput is 981Mbps + 967Mbps = 1948Mbps.
1962/1948 = 1.007 (separating the NICs shows a 0.7% decrease).

We hope that this post helps remind you that wifi is subject to RF interference from a variety of sources including active clients on a neighboring channel as well as the active wifi NIC in the next PCI-E slot.

If you would like more info on using LANforge for wireless testing, please contact us at sales@candelatech.com or call +1-360-380-1618.

Redirecting Web Browsing Using Squid and DNSMasq

When testing a captive portal with a virtual station on a LANforge machine, you are faced with a problem of multiple gateways. When the station associates, it gains a DHCP address with a new gateway and DNS server. Your LANforge machine will already have a default gateway and DNS server assigned to it throught the management interface it has on boot. You need to use both. On top of that, you are connected via screen-sharing to a laptop and not to the LANforge machine directly.

When You Have a Serial Console

If you’re lucky, you have a working serial console connection between the screen-share laptop and the LANforge system. I mention working because sometimes the quality of USB serial adapters is spotty. When it works, you have a way to set new values into /etc/resolv.conf and a default gateway.

Getting the station information via the command-line is something you can do using the lf_portmod.pl script:

/home/lanforge/scripts $ ./lf_portmod.pl --manager localhost \
 --card 1  --quiet yes \
 --port_name wlan0  --show_port
 
 >>RSLT: 0 Cmd: 'nc_show_port' '1' '1' 'wlan0'

Shelf: 1, Card: 1, Port: 3 Type: STA Alias: 
...
 IP: 10.45.1.2 MASK: 255.255.255.0 GW: 10.0.0.1 VID: 0 ResetState: COMPLETE
 DNS Servers: 8.8.8.8
 IPv6-Global: DELETED
 IPv6-Link: fe80::a00:27ff:fe0a:973d/64
 IPv6-Gateway: DELETED
 MAC: 08:00:27:0a:97:3d DEV: wlan0 MTU: 1500 TX Queue Len: 1000
...

Note down your existing route information:

$ route -n > existing_route.txt

Set your route to the laptop so you don’t loose it. Then update your new route:

$ sudo route add -host $laptop-ip dev eth0
$ sudo route set default gw 10.0.0.1

Next, re-order the entries in your /etc/resolv.conf file:

nameserver: 176.168.1.1
nameserver: 8.8.8.8 
# nameserver: 176.168.1.1

And that should allow your browser to work well enough. If you fat-finger the routes, you can renew the DHCP address on your management port (eth0) using the ifup/ifdown commands:

$ sudo ifdown eth0; sudo ip a flush eth0; sudo ifup eth0

And that should restore your management connection to what you had during boot up.

Often–No Serial Console

The problem is, everything your browser will want to do will use your default gateway, not the virtual stations. Changing the default gateway will drop your connection to the LANforge machine and you will be lost from it. When you are developing remotely, you can waste days waiting for your remote counterpart doing hands-on to reboot the LANforge when you lose the network settings. Luckily, LANforge boxes come with squid and dnsmasq installed.

Starting with dnsmasq

We can start by setting up dnsmasq, so that we can direct DNS requests through the stations DNS setting.

  1. Update /etc/resolv.conf to point at localhost:
    nameserver 127.0.0.1
    # old nameserver:
    nameserver: 176.168.1.1
  2. Update the /etc/dnsmasq.conf to query the station’s DNS server:
    server=8.8.8.8

Then start dnsmasq:

$ sudo systemctl start dnsmasq

Tail your system logs to check for typos:

$ journalctl -f

Test a DNS query:

$ host www.cnn.com 127.0.0.1
Using domain server:
Name: 127.0.0.1
Address: 127.0.0.1#53
Aliases: 

www.cnn.com is an alias for turner-tls.map.fastly.net.
turner-tls.map.fastly.net has address 151.101.1.67
turner-tls.map.fastly.net has address 151.101.65.67
turner-tls.map.fastly.net has address 151.101.129.67
turner-tls.map.fastly.net has address 151.101.193.67
turner-tls.map.fastly.net has IPv6 address 2a04:4e42::323
turner-tls.map.fastly.net has IPv6 address 2a04:4e42:200::323
turner-tls.map.fastly.net has IPv6 address 2a04:4e42:400::323
turner-tls.map.fastly.net has IPv6 address 2a04:4e42:600::323

Do not enable dnsmasq using $ sudo systemctl enable dnsmasq; sudo systemctl daemon-reload. That will take effect after a reboot and you might not remember doing it. Please remember to comment out 127.0.0.1 in /etc/resolv.conf.

Move onto squid

We want to set the tcp_outgoing_address setting in our /etc/squid/squid.conf file.

tcp_outgoing_address 10.45.1.2

Start squid:

$ sudo systemctl start squid

Open a terminal and tail squid logs:

$ cd /var/log/squid; sudo tail -F *log

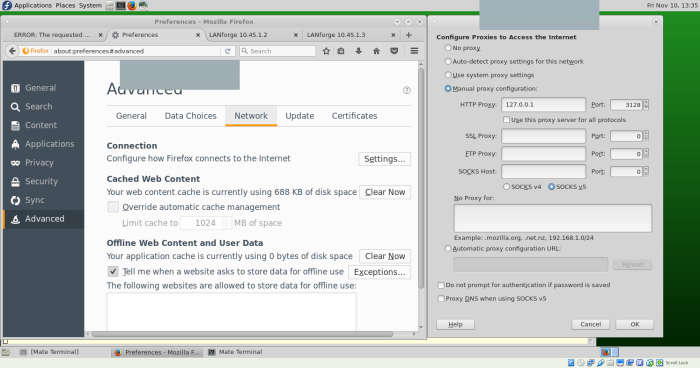
Next configure FireFox

The Network settings in FireFox are under Edit→Preferences and Advanced→Network. Edit the HTTP proxy to be 127.0.0.1 and port 3128. Erase the values for No Proxy for because having 127.0.0.1 and localhost in there will force FireFox to make no connections whatsoever.

Screenshot at 2017-11-10 13:35:08

Verify with tcpdump

Now the fun begins! We want to see web traffic and DNS queries flowing out the station interface and NOT the management interface. Open two windows, for two different tcpdump sessions. Monitor the management port:

$ sudo tcpdump -eni eth0 port 80 or port 53 or port 443

And monitor the station:

$ sudo tcpdump -eni wlan0 port 80 or port 53 or port 443

Using curl

to watch for redirects

Capturing a captive portal redirect is usually a matter of sending any HTTP request over the station and the response will be a 302 (or 307) redirect.

$ source ~/lanforge.profile # sets path
$ which curl # should be /home/lanforce/local/bin/curl
$ curl -svLki -4 
   --interface wlan0 \
   --localaddr 10.45.1.2 \
   --dns-interface wlan0 \
   --dns-ipv4-addr 10.45.1.2 \
   --dns-servers 8.8.8.8 \
   http://1.1.1.1/

Use the portal-check.pl script

In the /home/lanforge/scripts directory, you might have a portal-check.pl script. This script performs most of the outlines steps discussed so far. It is useful for helping validate the environment and gathering data to use with portal-bot.bash.

A response looks like:

< Location: http://portal.example.com:8080/
< Content-Type: text/html; charset=UTF-8
< Date: Fri, 10 Nov 2017 22:05:01 GMT
< Expires: Sun, 10 Dec 2017 22:05:01 GMT
< Cache-Control: public, max-age=2592000
* Server gws is not blacklisted
< Server: gws
< Content-Length: 219
< X-XSS-Protection: 1; mode=block
< X-Frame-Options: SAMEORIGIN
< 
<HTML><HEAD><meta http-equiv="content-type" content="text/html;charset=utf-8">
<TITLE>301 Moved</TITLE></HEAD><BODY>
<H1>301 Moved</H1>
The document has moved
<A HREF="http://portal.example.com:8080/">here</A>.
</BODY></HTML>


When diagnosing behavior of captive portals, often they are constructed to redirect to arbitrary high-level ports. Feel free to add more ports to your tcpdump filter. But at this point, curl is probably going to be your best friend.
#

Controlling ARP Solicitations

When your network endpoints are not changing during testing scenario, transmitting ARP packets at the default rate is arguably wasted bandwidth. You can tune the Linux networking stack to extend the time between ARP broadcasts.

These tunables are in /proc/sys/net/ipv4/neigh and are divided by default and per-device settings. The knobs I find that are useful are:

  • base_reachable_time: a guideline on how often to broadcast for ARP updates
  • gc_stale_time: threshold in seconds on when to consider evicting an arp entry
  • locktime: minimum time to keep an ARP entry

You can set twist these knobs for two ports in a shell script like so:

for f in /proc/sys/net/ipv4/{enp2,enp3}/{base_reachable_time,gc_stale_time,locktime} ; do
    echo 300 > $f
done

This changes the values to 5 minutes.

Adequate Power

Getting the wave-2 chipset working over the air has been surprisingly challenging.  Cabled transmission (SMA cables) to an AP was working mildly well,  and over the air (OTA) transmission was just not working at all.

We decided to investigate the power requirements of the chip. We were told that power draw would be up to 14 watts. We’ve seen PCIe cards draw 12W from the PCIe bus before. This radio has power connector points on the board for an extra 5v lead.

To our surprise, hooking up a 5V lead from a floppy drive power header on the motherboard was inadequate. So we attached multi-meters and saw that it was pulling the 5v line down to 4.22V and drawing 2.5amps. Holy cow!

We decided we needed power off of the 12V line. Soldering up a 15W linear regulator, we got a much steadier 5V supply to the card. It worked!

image
Multi-meters connected to measure current draw and voltage levels
image
Heat sink on the DC regulator

This time,  we were able to connect a station to the AP and start a 850Mbps download without any trouble. Whew!

Measuring Jitter

In verifying our latest software release for LANforge, I wanted an independent way to verify and measure the jitter imposed on a wanlink. There are many ways to accomplish this, but here is a summary of my procedure.

  • Synchronize clocks
  • Setup a wanlink with delay and jitter
  • Start captures on sender and receiver
  • Start UDP traffic in one direction
  • Run the captures through a script to estimate the jitter
  • Compare to LANforge jitter measurement

The information from the following links was very helpful in creating a bash script to calculate jitter from wireshark captures:

The network topology I used was two computers each with a network interface connected to the other through a switch. Each computer is running the LANforge software, so I was able to create a wanlink on one interface so that the latency and jitter impairments would affect packets leaving that interface.

netsmith-wanlink

To synchronize the clocks, I used ntpd on one system and ntpdate on the other.

The wanlink was set to 1.544Mbps with 10ms of delay and 100ms of jitter at a frequency of 1%. As I was capturing traffic, I varied the jitter frequency from 1% to 10% to 50% then 0%. See the LANforge User Guide for a detailed explanation of how jitter is set:

https://www.candelatech.com/lfgui_ug.php#wl_mod

wanlink

I initiated the wireshark captures from the LANforge Port Manager, but could have also used tshark to do this.

The UDP traffic was a one-way 56Kbps connection from eth1 on one system to the virtual interface behind the wanlink on the other system. The connection ran for about 180 seconds while I varied the jitter frequency on the wanlink.

I stopped the captures and filtered out all other traffic such as arps or icmps so that only lanforge protocol traffic remained and then ran the captures through the getjitter.bash script which also generated this image:

1-10-50-0-jitter

This matched up to what the LANforge Dynamic Report tool displayed for the jitter measurement on the connection:

1-10-50-0-jitter-dyn-rpt

The bash script below is used as follows:

./getjitter.bash sender.pcap receiver.pcap

It uses tshark, bc, gnuplot and qiv. It could probably be cleaned up, but the jitter estimate appears to be accurate.

#!/bin/bash

tshark -r $1 -T fields -e frame.time_epoch > frametimeS
tshark -r $2 -T fields -e frame.time_epoch > frametimeR
tshark -r $1 |awk '{print $2}' > ticks
tshark -r $1 -T fields -e udp.length > rates

declare -a S=(`cat frametimeS`)
declare -a R=(`cat frametimeR`)
declare -a T=(`cat ticks`)
declare -a Rate=(`cat rates`)
jitter=0
i=0

j=`echo ${#S[@]}`
let j=$j-2

for ((k=0; k<=$j; k++)); do
 #echo "${R[$i]} ${R[i+1]}"
 D=`echo "(${R[i+1]} - ${R[$i]}) - (${S[i+1]} - ${S[$i]})" |bc |tr -d -`
 rate=`echo "((${Rate[$i]}*8) / (${S[i+1]} - ${S[$i]}))" |bc |tr -d -`
 jitter=`echo "$jitter + ($D - $jitter)/16" |bc -l`
 #printf "%12s - %12s = %12s , %12s\n" ${R[i+1]} ${R[$i]} $D $jitter
 echo "${T[$i]} $jitter $rate" >> myjitter
 i=$i+1
done

echo 'set style data points' > jitter.gp
echo 'set nogrid' >> jitter.gp

echo 'set style line 1 lt 1 lw 2' >> jitter.gp
echo 'set style line 2 lt 2 lw 2' >> jitter.gp
echo 'set style line 3 lt 3 lw 5' >> jitter.gp
echo 'set style line 4 lt 3 lw 1' >> jitter.gp
echo 'set style line 5 lt 3 lw 2' >> jitter.gp
echo 'set style line 6 lt 3 lw 1' >> jitter.gp
echo 'set style line 7 lt 17 lw 2' >> jitter.gp
echo 'set style line 8 lt 17 lw 4' >> jitter.gp

echo 'set xlabel "Time (sec)"' >> jitter.gp
echo 'set ylabel "Jitter (sec)"' >> jitter.gp

echo 'plot "myjitter" using 1:($2/1) title "jitter" with impulses ls 6' >> jitter.gp

echo 'set term png' >> jitter.gp
echo 'set output "jitter.png"' >> jitter.gp
echo 'replot' >> jitter.gp

gnuplot jitter.gp 2>&1 1>/dev/null
qiv jitter.png &

The next steps for improving this jitter measurement would be to incorporate a sequence number check to look for drops and a latency measurement to get a more detailed evaluation of the impairments setup on the wanlink.

For the latency measurement, I came up with this script used as follows:

./getlatency.bash sender.pcap receiver.pcap

It makes use of the lanforge protocol as decoded by wireshark to acquire and verify sequence numbers.

#!/bin/bash

tshark -r $1 -T fields -e lanforge.seqno > seqno1
tshark -r $2 -T fields -e lanforge.seqno > seqno2
tshark -r $1 -T fields -e frame.time_epoch > frame1
tshark -r $2 -T fields -e frame.time_epoch > frame2
tshark -r $1 |awk '{print $2}' > ticks

declare -a array1=(`cat seqno1`)
declare -a array2=(`cat seqno2`)
declare -a frame1=(`cat frame1`)
declare -a frame2=(`cat frame2`)
declare -a T=(`cat ticks`)
latency=0
i=0

for key in "${!array1[@]}";
do
 if [ $key == ${array2[$key]} ]; then
 array1[$key]=${frame1[$key]}
 array2[$key]=${frame2[$key]}
 else
 unset array1[$key]
 unset array2[$key]
 fi
 
 latency=`echo "(${array2[$key]} - ${array1[$key]})*1000" |bc -l`
 if [[ $latency == 1[1-9][1-9]* ]]; then
 echo "${T[$key]} $latency" 
 fi
 echo "${T[$key]} $latency" >> mylatency
done

echo 'set style data points' > latency.gp
echo 'set nogrid' >> latency.gp

echo 'set style line 1 lt 1 lw 2' >> latency.gp
echo 'set style line 2 lt 2 lw 2' >> latency.gp
echo 'set style line 3 lt 3 lw 5' >> latency.gp
echo 'set style line 4 lt 3 lw 1' >> latency.gp
echo 'set style line 5 lt 3 lw 2' >> latency.gp
echo 'set style line 6 lt 3 lw 1' >> latency.gp
echo 'set style line 7 lt 17 lw 2' >> latency.gp
echo 'set style line 8 lt 17 lw 4' >> latency.gp

echo 'set xlabel "Time (sec)"' >> latency.gp
echo 'set ylabel "Latency (ms)"' >> latency.gp

echo 'plot "mylatency" using 1:($2/1) title "latency" with impulses ls 6' >> latency.gp

echo 'set term png' >> latency.gp
echo 'set output "latency.png"' >> latency.gp
echo 'replot' >> latency.gp

gnuplot latency.gp 2>&1 1>/dev/null
qiv latency.png &

Which produced this image:

1-10-50-0-latency.png

This shows that the capture files verify that there is about a 17ms baseline delay due to the 7ms serialization delay and 10ms additional delay setup on the wanlink. As I increased the jitter frequency, more packets experienced the 100ms jitter.